
By Elie Dufeu, CTO & Co-Founder, Metreecs. Published 21 August 2026.
Ecommerce demand forecasting predicts how many units of each product will sell, by channel, by time period, so your purchasing, inventory, and marketing decisions are grounded in data rather than instinct. The single first action to take: run a data-readiness check before touching any model or tool.
Three checks you can complete in under an hour:
- Pull your last 24 months of product-level daily sales and confirm there are no gaps longer than 7 consecutive days.
- Verify that each product has a consistent unit-of-measure across all channels (units, not sometimes units and sometimes packs).
- Confirm that promotions are tagged in your order data with start and end dates.
Once those pass, here is a practical path from zero to a working forecast in 30–60 days:
- Week 1–2: Audit and clean your historical sales data; separate returns from gross sales at the product level.
- Week 2–3: Map your supplier lead times and calculate variance per vendor.
- Week 3–4: Tag your promotions calendar and align it to your sales history.
- Week 4–6: Run a baseline statistical forecast (moving average or exponential smoothing) and measure its error against held-out data.
- Week 6–8: Pilot the forecast on your top 20% of products by revenue; embed reorder triggers into your purchasing workflow.
That sequence is achievable without a data science team. What it requires is clean data, a clear owner, and a willingness to treat the first forecast as a calibration exercise, not a finished product.
If your own data-readiness check turns up more gaps than clean data, Metreecs' demand planning platform is built to take a merchant from that starting point to a live, event-aware forecast without a dedicated data science hire.
Table of contents
- Why accurate ecommerce demand forecasting changes your outcomes
- Types and horizons of ecommerce forecasting you should know
- Why forecasts fail in ecommerce: common failure modes
- Data and feature checklist you must complete before forecasting
- Practical pros and cons of forecasting methods
- How to implement forecasting and run it as an operational process
- How to choose a forecasting tool: practical criteria and demo questions
- When event-aware, hybrid forecasting matters: research and practical implications
- A practitioner's view on getting forecasting live
- Frequently asked questions
- Sources
Key takeaways
Key Takeaways
- Accurate ecommerce demand forecasting requires clean product-level data, a method matched to your product type and horizon, and a forecast embedded directly into your purchasing workflow, not left in a separate analytics dashboard.
- 24 months of product-day sales history, lead-time variance, and tagged promotions are the minimum data readiness bar before any model will perform reliably.
- Use statistical time-series for stable A/X products; escalate to hybrid event-aware models for promotion-heavy or seasonal catalogs.
- The EventCast framework reported up to 86.9% MAE improvement during event-driven periods versus a variant without event knowledge.
- A forecast that requires manual export to purchasing gets ignored within 90 days; automating the reorder trigger is the step that actually changes behavior.
Why accurate ecommerce demand forecasting changes your outcomes
The financial case for better forecasting is direct. Stockouts cost revenue and customer trust simultaneously; overstock ties up working capital and drives markdown pressure. Both errors cut into margin, and in ecommerce, where cart abandonment and returns already erode demand signal quality, a forecast that is even modestly more accurate compounds its value across every downstream decision.
U.S. retail ecommerce sales reached $326.7 billion in Q1 2026, a 9.8% increase year-over-year, and now account for 16.9% of total retail sales. Globally, ecommerce is forecast to reach roughly $6.88 trillion in 2026 [SOURCE_NEEDED: confirm current-year global ecommerce forecast]. At that scale, even a 1–2 percentage point improvement in forecast accuracy translates into material working-capital savings for any merchant running meaningful product depth.
The operational levers that forecasting directly moves:
- Safety stock: A tighter forecast reduces the buffer you need to hold, freeing cash without increasing stockout risk.
- Reorder cadence: Accurate lead-time-adjusted forecasts let you shift from fixed-interval reordering to demand-driven triggers, reducing both emergency orders and excess receipts.
- PO batching: When you know demand 30–60 days out with confidence, you can consolidate purchase orders, negotiate better unit costs, and reduce freight frequency.
- Promotional pricing windows: Knowing which products are likely to spike before a campaign lets you pre-position inventory and set price floors that protect margin.
Target benchmarks to aim for (based on mid-market AI forecasting deployment guidance):
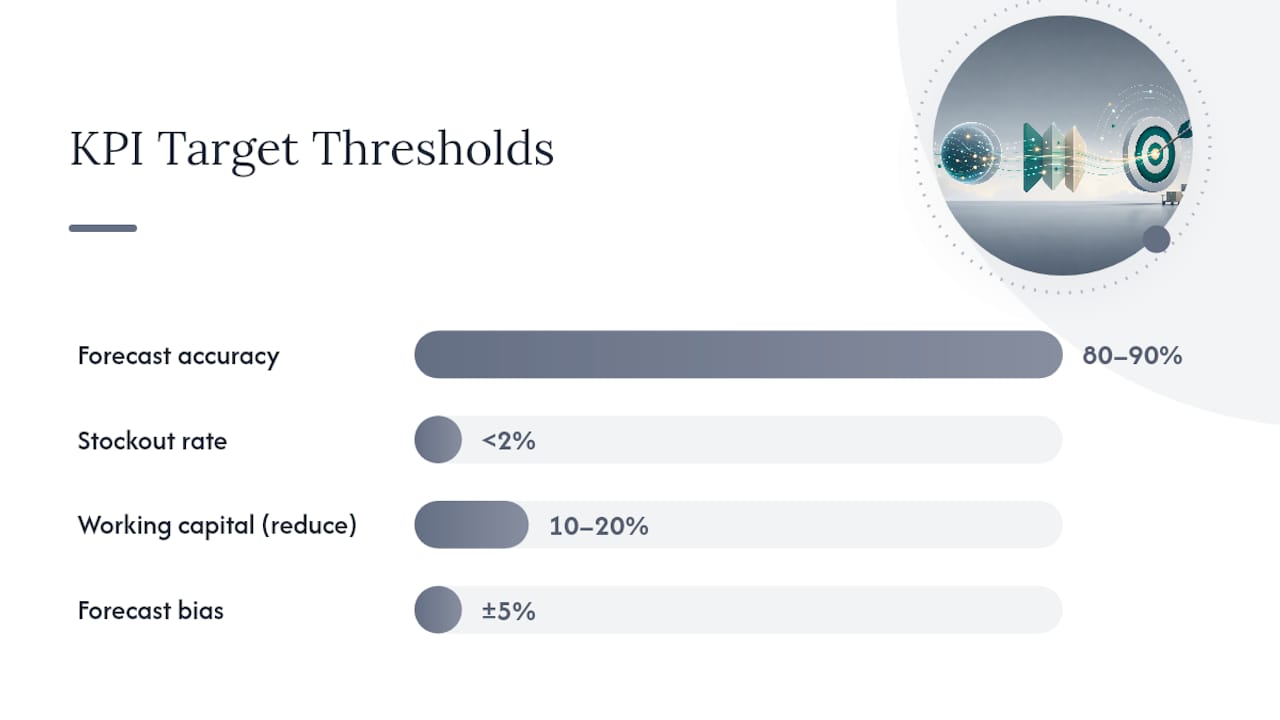
- Forecast accuracy (1 minus MAPE): 80–90% at the product-week level for A/X items.
- Stockout rate: below 2% for top-revenue products.
- Inventory turnover: 8–12x annually for fast-moving consumer goods; 4–6x for fashion.
The hidden cost of inaccurate forecasts is rarely a single catastrophic event. It accumulates quietly through excess safety stock, expedited freight, and missed promotional windows until it shows up as a margin problem that looks structural but is actually operational.
Types and horizons of ecommerce forecasting you should know
Not all forecasts serve the same decision. Matching the forecasting horizon to the operational decision it informs is one of the most underappreciated disciplines in demand planning for ecommerce.
Forecasting horizons and the decisions they drive
- Demand sensing (T+1 to T+7 days): Feeds daily replenishment, warehouse pick-pack prioritization, and same-day fulfillment allocation. Requires high-frequency data (hourly or daily sales, real-time inventory positions). Errors here cause immediate stockouts or overcommitment to fulfillment slots.
- Short-term (T+8 to T+30 days): Drives reorder point triggers, promotional pre-positioning, and supplier call-offs. This is the most operationally critical horizon for most ecommerce merchants.
- Mid-term (T+31 to T+90 days): Informs purchase order planning, seasonal buys, and capacity reservation with 3PL partners. Accuracy at this horizon determines whether you enter peak season with the right depth.
- Long-term (T+91 to T+365 days): Supports financial planning, assortment decisions, and new-product introduction timelines. Precision matters less here than directional accuracy and scenario ranges.
Method flavors and when to use each
Academic supply chain guidance and vendor algorithm documentation both converge on the same principle: method selection should follow the decision, not the other way around.
- Qualitative methods (expert judgment, market research): Best for new products with no sales history, or for macro-level assortment decisions where data is sparse. Fast to implement; not scalable.
- Statistical time-series (moving average, exponential smoothing, ARIMA): Reliable for stable, high-volume products with consistent demand patterns. Explainable, low maintenance, but blind to external events.
- Causal/regression models: Add external variables (promotions, price, weather, competitor actions) as inputs. Better for event-driven categories but require careful feature engineering.
- Machine learning and deep learning (gradient boosting, LSTM, Transformer-based): Handle large product catalogs, multi-channel data, and complex seasonality well. Higher data requirements and maintenance burden.
- Hybrid/event-aware models: Combine a statistical or ML baseline with a separate event-reasoning layer. Best for businesses with frequent promotions, seasonal spikes, or external demand drivers. This is the current leading approach for mature ecommerce programs.
Product-type matching: A/X products (high volume, stable demand) respond well to exponential smoothing or ARIMA. C/Z products (low volume, lumpy or intermittent demand) need intermittent demand models (Croston's method, or Bayesian approaches) or qualitative overrides. Applying a single model family across an entire catalog produces some of the worst forecast errors in ecommerce, since a method tuned for high-volume A/X products will consistently misfire on lumpy, intermittent C/Z tail products.
Why forecasts fail in ecommerce: common failure modes
A forecast that looked reasonable in development can degrade quickly in production. The failure modes below are not edge cases; they are the standard reasons why ecommerce teams find their models drifting within 60–90 days of go-live.
- Promotional uplift mis-tagging: When a promotion runs but is not tagged in the training data, the model learns the spike as organic demand and inflates the baseline. The next forecast without a promotion then overpredicts, causing overstock.
- Channel blending: Aggregating sales across Amazon, your own DTC site, and wholesale into a single demand signal hides channel-specific patterns. A DTC spike during a flash sale looks identical to an Amazon Buy Box win in blended data, but they have completely different replenishment implications.
- Returns contamination: Gross sales minus returns is not the same as net demand. If your model trains on gross order volume, it will systematically overforecast for high-return categories (apparel, electronics).
- Data gaps and timezone misalignment: A missing week of sales data during a holiday period teaches the model that demand drops when it actually spiked. Timezone inconsistencies between your storefront, warehouse, and ERP create phantom demand shifts.
- New-product cold start: A new product with fewer than 8 weeks of history gives a statistical model almost nothing to work with. Without a look-alike product strategy or qualitative override, the model will underforecast consistently.
- Lead-time variance: If your model assumes a fixed 14-day lead time but your supplier delivers anywhere from 10 to 21 days, your reorder points will be wrong half the time regardless of how accurate the demand forecast is.
- Viral and social demand spikes: A product featured in a TikTok video or a media article can generate demand that is 10–50x the baseline within 24 hours. No historical model predicts this; you need a real-time alert layer and a manual override protocol.
Each failure mode shows up differently in your metrics. Promotional mis-tagging creates positive bias (consistent overforecasting). Channel blending creates high MAE with low bias (errors in both directions). Returns contamination creates category-level positive bias. Lead-time variance shows up as a high stockout rate even when forecast accuracy looks acceptable.
Pro Tip:When a forecast is consistently wrong, run three checks before adjusting the model: (1) verify that the training data period includes at least one full promotional cycle; (2) confirm that returns are excluded from the demand signal; (3) check whether lead-time variance in the last 90 days has widened beyond the model's assumed range. Most persistent forecast bias traces back to one of these three inputs, not the model itself.
Priya ran demand planning for a mid-size beauty brand selling through its own DTC site, Amazon, and three wholesale accounts. For a year, her forecasts blended all three channels into one demand curve, so every flash sale on the DTC site showed up as a spike that looked identical to a good week on Amazon. Once she split the channels and rebuilt the model on channel-level history, forecast error on her top 50 products dropped enough that she stopped manually overriding roughly a third of her weekly reorder recommendations.
One mistake we repeatedly see is a team building a forecast on top of gross sales data that still includes returns, then wondering why the model systematically overshoots in apparel and electronics, the two categories where return rates run highest.
Data and feature checklist you must complete before forecasting
Operational readiness, specifically 24 months of product-level sales history, lead-time variance fields, and channel disaggregation, is the most common gating factor for successful AI forecasting deployment among mid-market merchants [SOURCE_NEEDED: confirm current deployment-readiness benchmark source]. Getting the data right before selecting a model saves weeks of recalibration later.
Minimum datasets required
- Product-day sales history: At least 24 months, disaggregated by channel (DTC, marketplace, wholesale). Include order date, ship date, and fulfillment channel.
- Returns data: Gross units ordered and net units retained, by product and return reason code.
- Pricing history: Selling price by product by day, including markdown events.
- Promotions calendar: Campaign name, start date, end date, discount depth, and channel scope.
- Marketing spend: Daily or weekly spend by channel (paid search, email, social), linked to product or category.
- PO receipts and lead-time history: Actual receipt date versus expected date, by supplier and product, for at least 12 months.
- Inventory positions: Daily on-hand, on-order, and in-transit quantities by location.
- External signals (optional but high-value): Weather data for weather-sensitive categories, search trend indices, and competitor pricing where available.
Data hygiene rules
- Product canonicalization: Ensure every variant (size, color, bundle) maps to a single canonical product identifier. Duplicate or split product records are one of the most common causes of forecast fragmentation.
- Returns separation: Never net returns against sales in the raw data layer. Keep gross and net as separate fields so models can be trained on either depending on the decision.
- Timezone alignment: Standardize all timestamps to a single timezone (UTC is the safest default) before aggregation.
- Unit-of-measure consistency: A product sold as a single unit on your DTC site but as a case pack on Amazon must be normalized to a single base unit before modeling.
Sample queries for critical features
The following SQL patterns compute three features that most forecasting tools expect as inputs but that few merchants have pre-built:
Lead-time variance per supplier:
SELECT supplier_id,
       AVG(actual_receipt_date - expected_receipt_date) AS avg_lead_time_days,
       STDDEV(actual_receipt_date - expected_receipt_date) AS lead_time_stddev
FROM purchase_orders
WHERE order_date >= CURRENT_DATE - INTERVAL '365 days'
GROUP BY supplier_id;
Promotional uplift per product:
SELECT sku_id,
       AVG(CASE WHEN promo_flag = 1 THEN daily_units_sold END) /
       NULLIF(AVG(CASE WHEN promo_flag = 0 THEN daily_units_sold END), 0) AS promo_uplift_ratio
FROM daily_sales
GROUP BY sku_id;
Days of inventory on hand:
SELECT sku_id,
       on_hand_units / NULLIF(AVG(daily_units_sold) OVER (PARTITION BY sku_id ORDER BY date ROWS 30 PRECEDING), 0) AS days_of_inventory
FROM daily_inventory
JOIN daily_sales USING (sku_id, date);
These three outputs (lead-time variance, promotional uplift ratio, and days of inventory) feed directly into safety stock calculations and reorder point logic. Building them before you evaluate any forecasting tool means you can validate vendor claims against your actual data during the demo.
Practical pros and cons of forecasting methods
Method selection is a decision about trade-offs, not a search for a universally superior algorithm. Microsoft's supply-chain algorithm documentation and ResearchGate's technical review of AI/ML approaches in ecommerce both confirm that no single method dominates across all product types, horizons, and data volumes.
Method familyProsConsIdeal use caseStatistical time-series (ARIMA, ETS, Holt-Winters)Explainable, low data requirements, fast to deployBlind to external events; degrades on lumpy demandStable A/X products, short-horizon replenishmentCausal/regressionIncorporates promotions, price, weather; good interpretabilityRequires clean feature engineering; sensitive to multicollinearityPromotion-heavy categories, price-elastic productsMachine learning (gradient boosting, random forest)Handles large catalogs, captures non-linear patternsHigher data volume needed; less explainable; maintenance-heavyHigh-product-count catalogs, multi-channel merchantsDeep learning (LSTM, Transformer)Captures long-range temporal dependencies; strong on seasonal patternsRequires large datasets; slow to retrain; black-box outputsEnterprise-scale catalogs with rich historyHybrid/event-aware (statistical + LLM event layer)Best accuracy during event-driven periods; separates baseline from event uplift; interpretableMore complex to build and maintain; requires structured event dataPromotion-intensive, seasonal, or event-driven businesses
The explainability dimension deserves particular attention for ecommerce operations teams. A model that produces a reorder recommendation without a traceable reason is difficult to override confidently when a buyer's intuition conflicts with the output. Statistical and causal models win on explainability; ML and deep learning models typically require additional tooling (SHAP values, feature importance plots) to make their outputs auditable.
Statistic callout: The EventCast research paper reported up to 86.9% MAE improvement and 97.7% MSE improvement during event-driven periods versus a variant trained without event knowledge. Those figures come from a production deployment across multiple regions since March 2025, which makes them operationally grounded rather than purely experimental.
Pro Tip:During any promotional window, run your event-aware model and your baseline model in parallel for at least 4 weeks before switching fully. Compare their MAE on held-out promo-period data.
How to implement forecasting and run it as an operational process
A working forecasting program is a workflow, not just a model. The model is one component. The operating model around it (who reviews exceptions, how reorder triggers fire, when the calendar gets updated) determines whether the forecast actually changes purchasing behavior.
Step-by-step implementation playbook
- Define the objective and success metrics. Before any data work, agree on which decisions the forecast will drive (reorder triggers, promotional pre-buy, financial planning) and which KPIs will measure success. Without this, the program drifts.
- Complete the data-readiness checklist. Use the fields and queries from the previous section. Do not skip this step to save time; data gaps discovered after model training cost more to fix than gaps discovered before.
- Classify your products using ABC/XYZ. ABC ranks products by revenue contribution (A = top 80%, B = next 15%, C = bottom 5%). XYZ ranks by demand variability (X = stable, Y = seasonal, Z = lumpy/intermittent). The intersection determines which model and which safety stock formula applies to each product class.
- Run a backtest on 6–12 months of held-out data. Train the model on the earlier period and measure its error on the held-out period. This is your baseline accuracy before any tuning.
- Tag your promotions calendar as uplift multipliers. Each planned campaign should enter the model as a feature, not as raw historical data. This prevents the model from learning promotional spikes as organic baseline demand.
- Pilot on your top 20% of products by revenue. A/X products are the right starting point: they have enough history to train on, enough volume to make errors visible, and enough revenue impact to justify the investment.
- Calibrate safety stock and reorder points by product class. A common formula for safety stock is:
Safety Stock = Z × σ_LT × √LT, where Z is the service-level z-score (1.65 for 95%), σ_LT is the standard deviation of daily demand, and LT is the lead time in days. For C/Z products, use a higher Z or a fixed buffer based on supplier minimums. - Embed the forecast into your PO workflow. A forecast that lives in a spreadsheet and requires manual translation into purchase orders will be ignored within 90 days. The reorder trigger must fire automatically, with a human review step for exceptions above a threshold.
- Set a weekly review cadence. Every Monday, review the top 10 exceptions (products where forecast error exceeded 30% in the prior week). Investigate root cause before adjusting the model.
- Run a post-launch KPI review at 30, 60, and 90 days. Compare forecast accuracy, stockout rate, and inventory turnover against your pre-launch baseline.
KPI targets and measurement framework
KPIMeasurement methodTarget thresholdForecast accuracy (1 minus MAPE)Weekly, at product level for A/X items80–90%Stockout rate% of product-days with zero inventoryBelow 2% for A-class productsInventory turnoverAnnual COGS / average inventory value8–12x (FMCG); 4–6x (fashion)Working capital tied upAverage inventory value in dollarsReduce by 10–20% versus pre-forecast baselineForecast biasMean error (positive = overforecast, negative = underforecast)Within ±5% at the category level
Pro Tip:For new products with fewer than 8 weeks of sales history, use a look-alike product approach: identify 3–5 existing products with similar attributes (category, price point, channel mix) and use their first-8-week demand curve as a prior. Adjust upward or downward based on any qualitative signal from the launch campaign. Revisit the model assignment at week 12 when you have enough data to train independently. For a deeper guide on handling new product introductions, the AI guide to new product introduction covers the cold-start problem in detail.
How to choose a forecasting tool: practical criteria and demo questions
The tool evaluation process is where many ecommerce teams lose weeks to vendor theater. A polished demo with impressive charts does not tell you whether the tool handles your specific failure modes: promotional uplift, new-product cold start, lead-time variance, or channel disaggregation. The questions below are designed to surface those answers quickly.
Core selection criteria
- Integration depth: Does the tool connect natively to your commerce stack (Shopify, Amazon Seller Central, WooCommerce) and your ERP or WMS? Native connectors reduce implementation time and data-pipeline maintenance.
- Product granularity: Can the tool forecast at the product-day-channel level, or does it aggregate to product-week or category-week? For most ecommerce merchants, product-week is the minimum useful granularity.
- Event and promotion support: Does the tool accept a structured promotions calendar as a model input, or does it treat promotions as noise? This is the single most important differentiator for businesses with more than 4 promotional events per year.
- Explainability: Can a buyer or operations manager understand why a specific reorder recommendation was generated? Look for feature importance outputs, override logs, and audit trails.
- PO workflow automation: Does the tool generate draft purchase orders or reorder recommendations that feed directly into your procurement system, or does it stop at a forecast number?
- Implementation timeline and maintenance burden: How long does onboarding take, and who maintains the model after go-live? AI-native platforms now allow merchants doing $2M–$50M ARR to deploy without a dedicated data scientist.
- SLAs and support: What are the uptime guarantees and response-time commitments? For a tool embedded in your purchasing workflow, downtime has direct operational cost.
Ten questions to ask in every vendor demo
- How does your model handle a product with fewer than 8 weeks of sales history?
- Can I input a structured promotions calendar, and how does the model use it during training versus inference?
- How does the tool disaggregate demand by channel (DTC vs. marketplace vs. wholesale)?
- What is the recommended minimum product-history length for reliable forecasts?
- How does the tool handle lead-time variance, and can I input supplier-level variance data?
- What does the exception workflow look like when a forecast error exceeds a threshold I define?
- Can I see a feature importance or explainability output for a specific product's reorder recommendation?
- How long does initial onboarding take, and what data formats do you require at ingestion?
- What KPIs do your existing customers typically see at 90 days post-launch?
- How does the model update when I run an unplanned promotion or a supplier delays a shipment?
A vendor who cannot answer questions 2, 3, and 6 clearly in a demo is unlikely to handle those scenarios well in production. Treat vague answers as a data point, not a reason to follow up later.
When event-aware, hybrid forecasting matters: research and practical implications
The core limitation of any purely historical model is that it cannot reason about the future. It can extrapolate patterns from the past, but it has no mechanism for encoding the fact that a major sales event is scheduled for next Friday, or that a competitor just announced a product recall that will redirect demand to your category.
Event-aware hybrid architectures address this by separating two distinct reasoning tasks: estimating the baseline demand trend from historical data, and estimating the incremental demand effect of a specific future event. The EventCast framework implements this as a dual-tower design, where one tower handles the numerical time-series signal and a second tower uses a large language model to encode semantic knowledge about upcoming events (promotions, holidays, product launches, external disruptions). The two outputs are combined before generating the final forecast.
Statistic callout: In production deployment across multiple regions since March 2025, EventCast reported up to 86.9% MAE improvement and 97.7% MSE improvement during event-driven periods versus the variant trained without event knowledge. Against industrial baselines (standard ML models already in production), the improvements were significant but more modest, which is the more operationally relevant comparison for most merchants.
Why does separating the two towers improve interpretability? Because the event adjustment is a discrete, auditable component. That is not possible when event effects are baked into a single model's weights.
How to collect event data and validate uplift in your own business
- Build a structured event register: Every planned promotion, holiday, product launch, or external event (trade show, media feature) should be logged with a start date, end date, affected product scope, and expected demand impact (even if that impact is initially a rough estimate).
- Convert the promotions calendar into model features: At minimum, create binary flags for "promo active" and numeric fields for "discount depth" and "channel scope." More sophisticated implementations add event-type embeddings.
- Run an A/B style validation: For your next 2–3 promotional events, generate forecasts from both your baseline model and your event-aware model before the event runs. After the event, compare each model's MAE against actual sales. This gives you a clean, business-specific estimate of the uplift from event awareness.
- Set a minimum event-history threshold: You need at least 6–8 comparable historical events to train a reliable uplift model. If you have fewer, use qualitative overrides and look-alike event benchmarks until the history accumulates.
For fashion brands and food and beverage operators, where promotional calendars are dense and seasonal patterns are sharp, event-aware forecasting is not an advanced feature.
A practitioner's view on getting forecasting live
The most common reason ecommerce forecasting programs stall isn't the model, it's the gap between a working forecast and a decision that actually changes. Teams spend weeks selecting a tool, months cleaning data, and then produce a forecast that sits in a dashboard while buyers continue placing orders based on gut feel and last year's actuals. The forecast never touches the PO.
Closing that gap requires two things that have nothing to do with algorithms. First, the forecast output must be in the same system where purchasing decisions are made, not in a separate analytics environment that requires a manual export. Second, there must be a named owner for the weekly exception review, with authority to escalate supplier issues and override the model when market conditions change. Without both, the program degrades within a quarter.
On seasonal peaks specifically: the instinct to overbuy before a peak is understandable, but it is usually the wrong response to forecast uncertainty. A better approach is to manage seasonal peaks by increasing reorder frequency rather than reorder quantity in the 6–8 weeks before peak. Smaller, more frequent orders reduce the cost of being wrong while keeping service levels high. This works only if your supplier lead times are short enough to support it, which is why lead-time variance data is non-negotiable before any peak-season planning.
Across Metreecs' work with fashion retail and food and beverage clients, the teams that get the most out of forecasting are not the ones with the most sophisticated models. They are the ones who embedded the forecast into their purchasing workflow within the first 60 days and committed to a weekly review cadence from day one.

Daniel leads inventory for a home goods retailer that spent four months evaluating forecasting vendors before choosing one. The tool worked well in the demo, but nobody assigned an owner for the weekly exception review, so for the first two months the forecast sat next to the old process instead of replacing it. Once he named a single owner and made the reorder trigger the default instead of an optional export, expedite freight spend fell within the first full quarter of live use, and the AI-powered inventory practices behind that shift are the same ones covered in the guide to reducing inventory waste.
Pro Tip:Schedule your go-live at least 10 weeks before your peak season, not during it. A model calibrated on pre-peak data and reviewed for 4–6 weeks before the peak arrives will outperform a more sophisticated model deployed mid-peak with no calibration history.
Frequently asked questions
What is ecommerce demand forecasting?
It's the process of predicting how many units of each product will sell, by channel and time period, using historical sales data and statistical or machine learning models. The output is a baseline number that purchasing, inventory, and marketing teams plan against.
How much historical sales data do I need to start forecasting?
At least 24 months of daily, product-level sales history disaggregated by channel, with no gaps longer than 7 consecutive days. Less than that, and most statistical models won't have enough signal to separate seasonality from noise.
How do I forecast demand for a brand-new product with no sales history?
Use a look-alike approach: find 3 to 5 existing products with similar category, price point, and channel mix, and use their early demand curve as a prior. Revisit the model once the new product has 8 to 12 weeks of its own data.
How often should I update an ecommerce demand forecast?
Short-term demand sensing should update daily or weekly to support replenishment. The consensus baseline feeding purchasing decisions typically gets reviewed monthly, with an exception review every week.
Can a small ecommerce brand forecast demand without a data science team?
Yes. A clean data-readiness checklist plus a baseline statistical model (moving average or exponential smoothing) gets most merchants a workable forecast. AI-native platforms have also lowered the bar for merchants in the $2M to $50M ARR range to run this without a dedicated data scientist.
What's the difference between demand forecasting and inventory planning?
Forecasting predicts expected demand. Inventory planning uses that forecast, plus lead time and safety stock targets, to decide how much to buy and when. One feeds the other; they are not the same process.
Conclusion
Accurate ecommerce demand forecasting starts with clean product-level data and a method matched to the product type and horizon, but it only pays off once the forecast is embedded directly into the purchasing workflow instead of sitting in a separate dashboard. Book a demo to see how Metreecs' event-aware forecasting performs against your own product catalog.
Sources
- Quarterly retail e-commerce sales report (U.S. Census Bureau): official U.S. retail ecommerce sales data for Q1 2026, used for the market-size figures in this article.
- EventCast: hybrid demand forecasting in e-commerce with LLM-based event knowledge: the research paper behind the event-aware MAE and MSE improvement figures cited above.
Our articles






































Own your operations with AI Intelligence
